5 Essential Tools for Technical Analysis on Trading Platforms
Emotional trading is one of a trader’s greatest enemies. It almost always ends up badly. When you make emotional decisions without considering real market data, you make uninformed decisions. Consequence? Loss of money. Therefore, nurturing emotional intelligence is crucial to excelling in the market. It requires a good understanding of the market and how sentiments drive prices, which requires technical analysis.
Trading without the right technical analysis tools could lead to poor decision-making and a loss of money. An effective trading strategy should use various technical analysis tools to give you insights into the supply and demand of whatever you are trading. This, in turn, allows you to identify patterns in price movement and make calculated moves. That includes acing entry and exit positions to maximize profits.
With brokers now offering these tools on their platforms directly, all you have to do is choose the right platform. Here are 5 essential technical analysis tools that your trading platform should have:
Chart Patterns
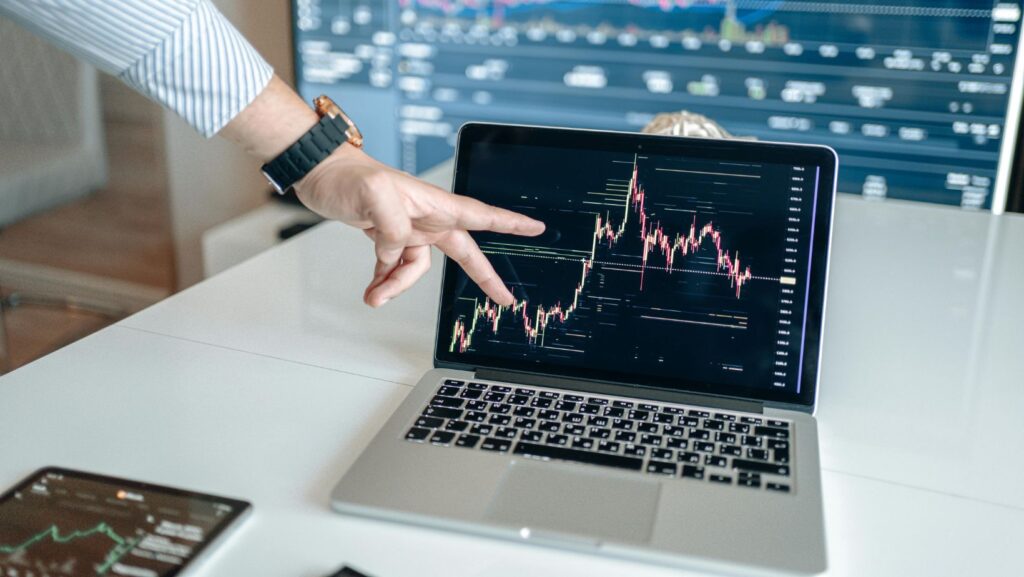
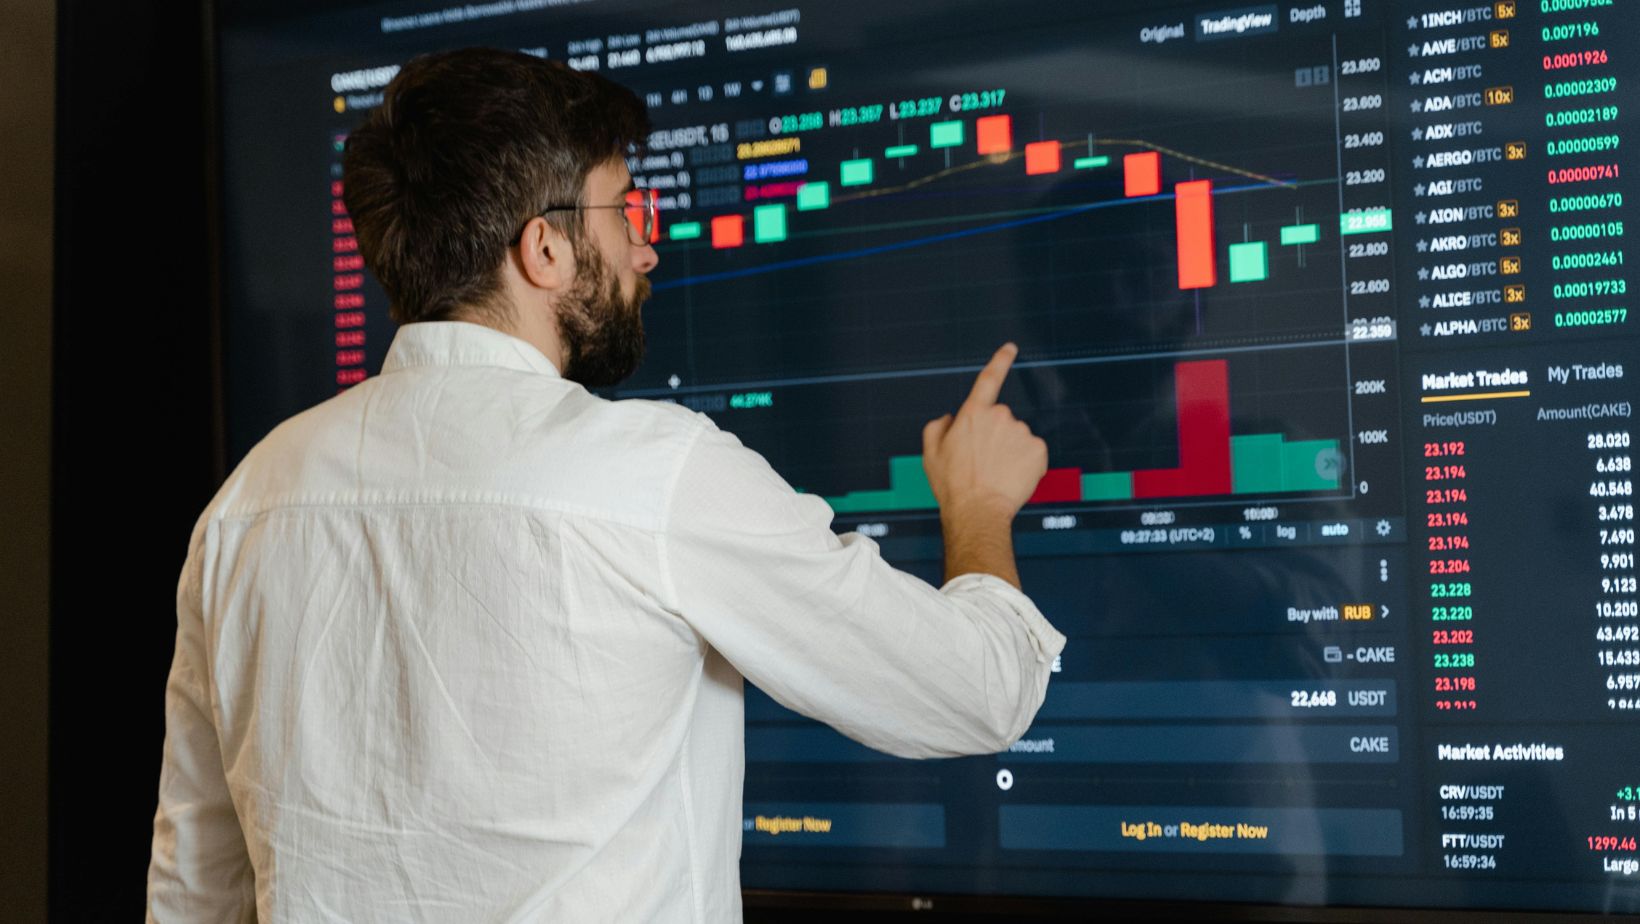
There are three main forms of charts, but candlesticks are the most used, unlike bar and line charts. Analyzing charts is part of every experienced trader’s technical analysis strategy. Without the visual representation, predicting price movements would have been much harder. To ease your work, leading platforms like RoboForex provide all the tools you need to identify and analyze these patterns.
Chart patterns show how traders feel about the price of the trading instrument. If traders are excited about XAUUSD, they buy more of it, and that’s reflected in a price increase; the opposite is true.
Traders tend to respond similarly to market events, whether driven by news or market sentiment. When a large number of traders react in the same way to an event, their collective actions become visible on the charts. As these behaviors are repeated over time, analysis of these charts reveals patterns that help predict future price movements.
Chart patterns usually indicate continuation or reversal. In continuation patterns, the price moves sideways, creating pennants, flags, or triangles. This means the trends continue in the same direction after a brief break.
On the other hand, reversal patterns appear at the end of a trend and show a potential change in price direction typical in a momentum loss. Head and shoulder patterns, double tops, and falling and rising wedges are only some examples.
Technical Indicators
Experienced traders know better than to execute trades based on pure emotions instead of the actual data; this is where technical indicators come in. These mathematical patterns created by past data can help predict future price trends. They provide traders with valuable insights about supply and demand, allowing them to make informed decisions.
Usually, a price increase accompanied by a high trading volume suggests strong buyer interest in an instrument, and the price will likely keep rising (bullish). If the price increases but the volume decreases, it indicates that investors don’t have much faith in the instrument. As such, traders can take this as a warning and either hold or sell in anticipation of a price drop (bearish).
There are more than 100 indicators, but they are classified into 4 main categories: volume, volatility, momentum, and trend. But you don’t need all of them; most traders usually focus on a few, like 4 or 5, that align with their trading strategy to avoid confusion.
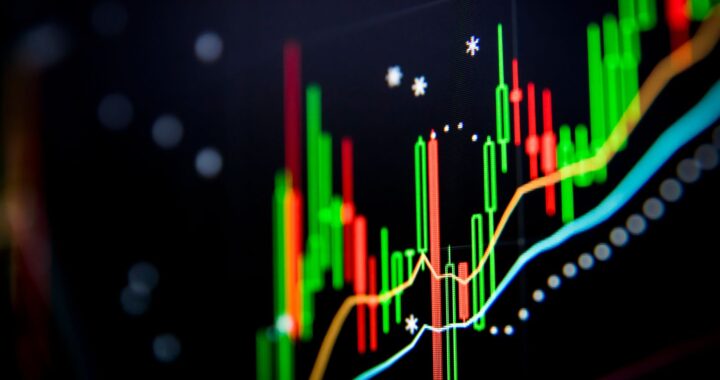
One widely used and common indicator in trading platforms is the Moving Average (MA), which helps traders identify trends. There’s also the Relative Strength Index (RSI), a momentum indicator that allows detect undervalued or overvalued conditions.
Others include Bollinger Bands, Stochastic oscillator, Fibonacci, On Balance Volume (OBV), and Moving Average convergence divergence (MACD).
Drawing Tools
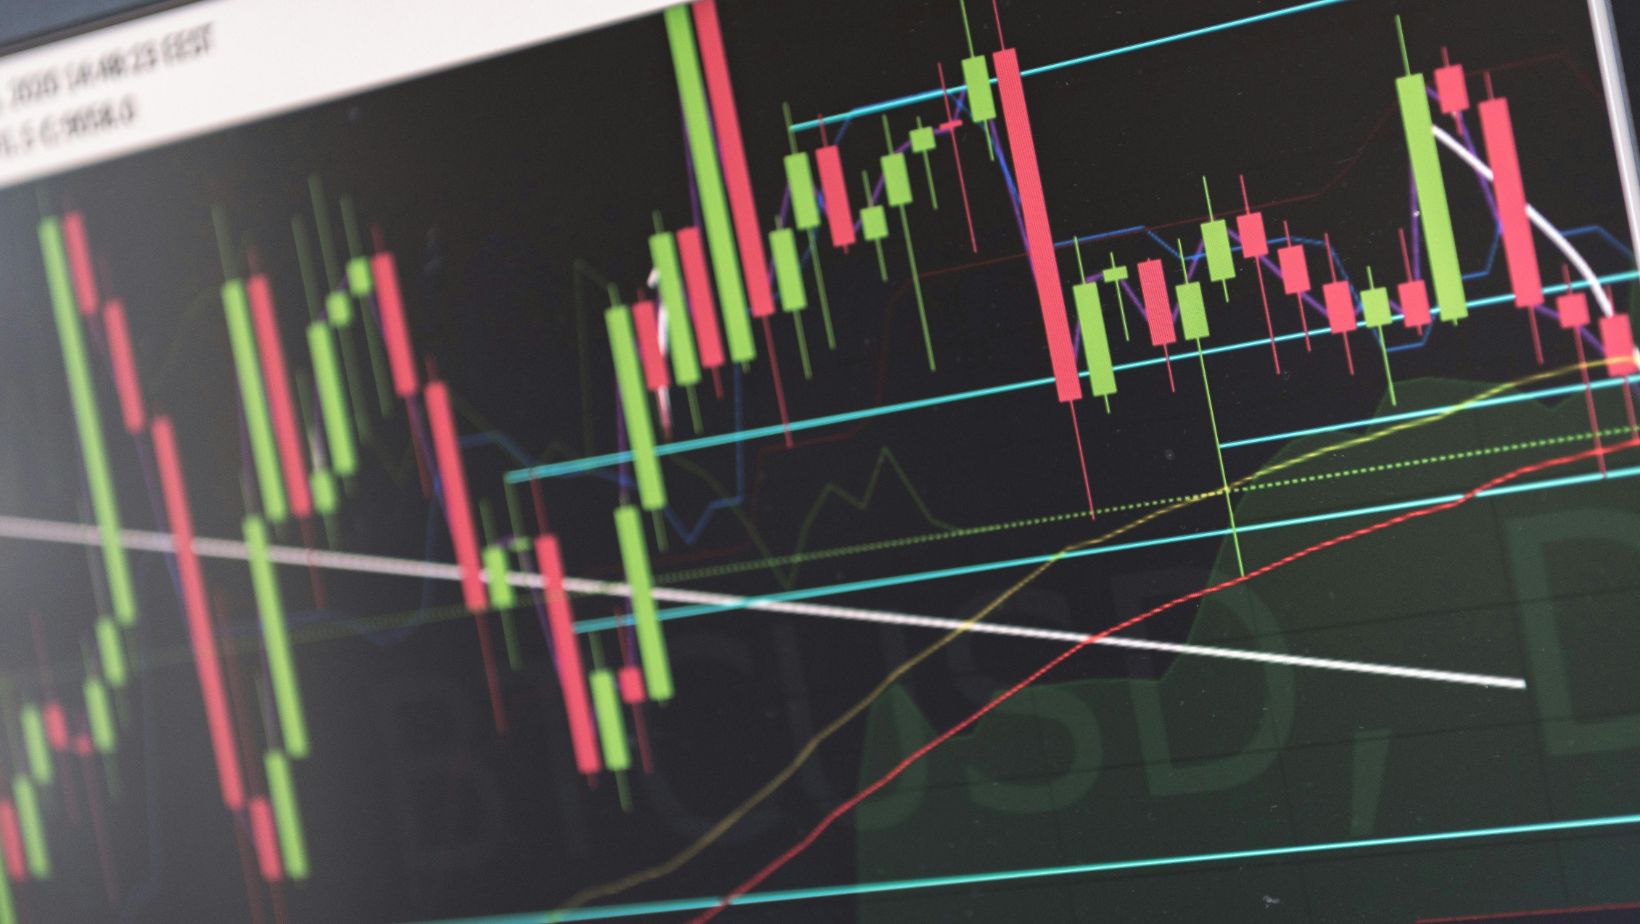
A trading platform should feature drawing tools to help traders visualize market trends, highlight patterns, and take notes. Tend lines, for instance, allow traders to clearly see how the price will likely perform. Horizontal lines help visualize price levels and pinpoint where prices will likely increase or decrease.
Drawing tools help traders execute their trading strategies by easily identifying chart patterns, such as triangle formations, through analysis.
By adding notes, drawing arrows, or labeling charts, traders can easily document their thoughts about them and discuss them with other traders. This helps them refine their strategy and plan trades.
Risk Management Tools
Understanding that the market is unpredictable, trading platforms provide traders with risk management tools. The most common ones are Stop loss (SL) and Take Profit (TP), preset price levels that help traders decide when to close a running trade.
Placing a TP order tells the broker where to close the trade and lock in the gained profits. That means you don’t need to watch the trades to close them when the price reaches a certain point. In the same way, SL is a predetermined price level where the trader decides to close the trade to limit losses.
Another essential tool is the position sizing calculator, which lets traders determine their position size before entering a trade. This helps them manage risk exposure and minimize potential losses.
Backtesting Tools
Some brokers have integrated their trading platform with backtesting tools, allowing trades to test their strategies quickly. Using past historical market data, these tools are designed to help traders assess how their trading strategies will perform in the real market. This allows them to refine their strategies before taking trades.
Conclusion
When choosing a trading platform, you must know what you need to succeed. Start by setting clear goals and identifying what you need to realize them. Most trades seek a reliable broker with a user-friendly platform, responsive customer support, and fast order execution speed.
Technical analysis tools are also crucial regardless of the asset you trade. Therefore, you must pick a platform that meets these criteria and provides all the technical analysis tools you need to crash the markets. That includes chart patterns, indicators, drawing tools, risk management features, and backtesting capabilities.


